Client review dashboard vs team dashboard: why we keep AI visibility reporting split
Why we keep one dashboard for the client review and another for the team's daily work, what goes on each, and how the review copy reaches the client.
The dashboard our team opens every morning is the wrong thing to share in a client review. Picture how it goes wrong. An analyst filters the view down to one engine and two prompts to chase a drop, forgets to reset it, and the next morning the client's marketing lead opens the same link and asks why their visibility has collapsed. Nothing collapsed. The filter did.
That is why we build two kinds of dashboard for every client program, and we keep them apart on purpose. One is for the people who pay for the work and meet us once a month. The other is for the people who do the work every day. This post is about that split: what each audience needs, what goes on each dashboard, and how the review version gets to the client without anyone assembling a deck. Our earlier note on how we build client AI visibility dashboards covers picking a question per dashboard. This one is about who is looking at it.
Two audiences, two speeds
A client stakeholder in a monthly or weekly review has a short list of questions. Are we named more often than last period? Against which competitors are we gaining or losing? Is it one engine or all of them? And what did the agency do that might explain it? They want the same few numbers, in the same order, measured the same way every time, so that a change on the page means a change in the world.
Our SEO team asks different questions, and asks them daily. Which prompts dropped yesterday? Which model moved? Which page started getting cited, and which Reddit thread replaced it? They need many widgets, lots of filtering, and the freedom to break the view and rebuild it before lunch.
Put both on one dashboard and each audience gets a worse version. The client sees noise and half-finished filters. The team stops experimenting because someone important might be watching. So we separate them.
Why the review dashboard stays untouched
The mechanics in Promptwatch make the separation easy, and they also make it necessary. According to the Promptwatch changelog, a saved custom dashboard (added September 22, 2026) keeps its own date range, models, prompt types, topics, and monitors. You can share it with the team or keep it personal. When you change a filter on a saved dashboard, you get the choice to reset it, update the dashboard, or save the changes as a new one. Since November 2 those unsaved changes sit in a bar that floats at the bottom of the page, with Reset and Save as new always in reach.
Here is the part that shapes our habits. A scheduled PDF report follows its dashboard. If you change the widgets or rename the dashboard, the next report picks that up. That is exactly what you want when the change is deliberate. It is a problem when an analyst tweaks the review dashboard to answer a quick question and clicks Update instead of Save as new. The client's next PDF quietly changes shape.
Our rule is simple. The review dashboard is a team dashboard, and only the account lead edits it. Anyone exploring uses Save as new, which leaves the review copy alone. The changelog also notes that making a team dashboard personal asks for confirmation first, because it stops other people's reports. We read that confirmation as a reminder of who else depends on the view.
What goes on the client review dashboard
We keep it to the metrics a stakeholder can repeat to their own boss. Promptwatch's definitions are clear enough to put in the meeting notes:
- Visibility Score, from 0 to 100: how prominently the brand appears in answers to the tracked prompts. Responses that don't mention the brand count as zero, so a narrow win on a few prompts doesn't inflate it.
- Share of Voice: the brand's slice of all brand mentions in the current filters, one mention per response per brand.
- Position: where the brand lands in the order of brands within an answer. Lower is better, which we say out loud every time, because someone always reads a falling number as bad news.
- Sentiment, scored separately from visibility, for the client who cares how they are described and not only whether.
Under those cards we put a ranked list of brands by visibility, so the client sees their name next to the competitors they actually worry about, and a competitor visibility heatmap with brands down the side and engines across the top. The heatmap is the widget that ends the "is it only ChatGPT?" conversation fastest.
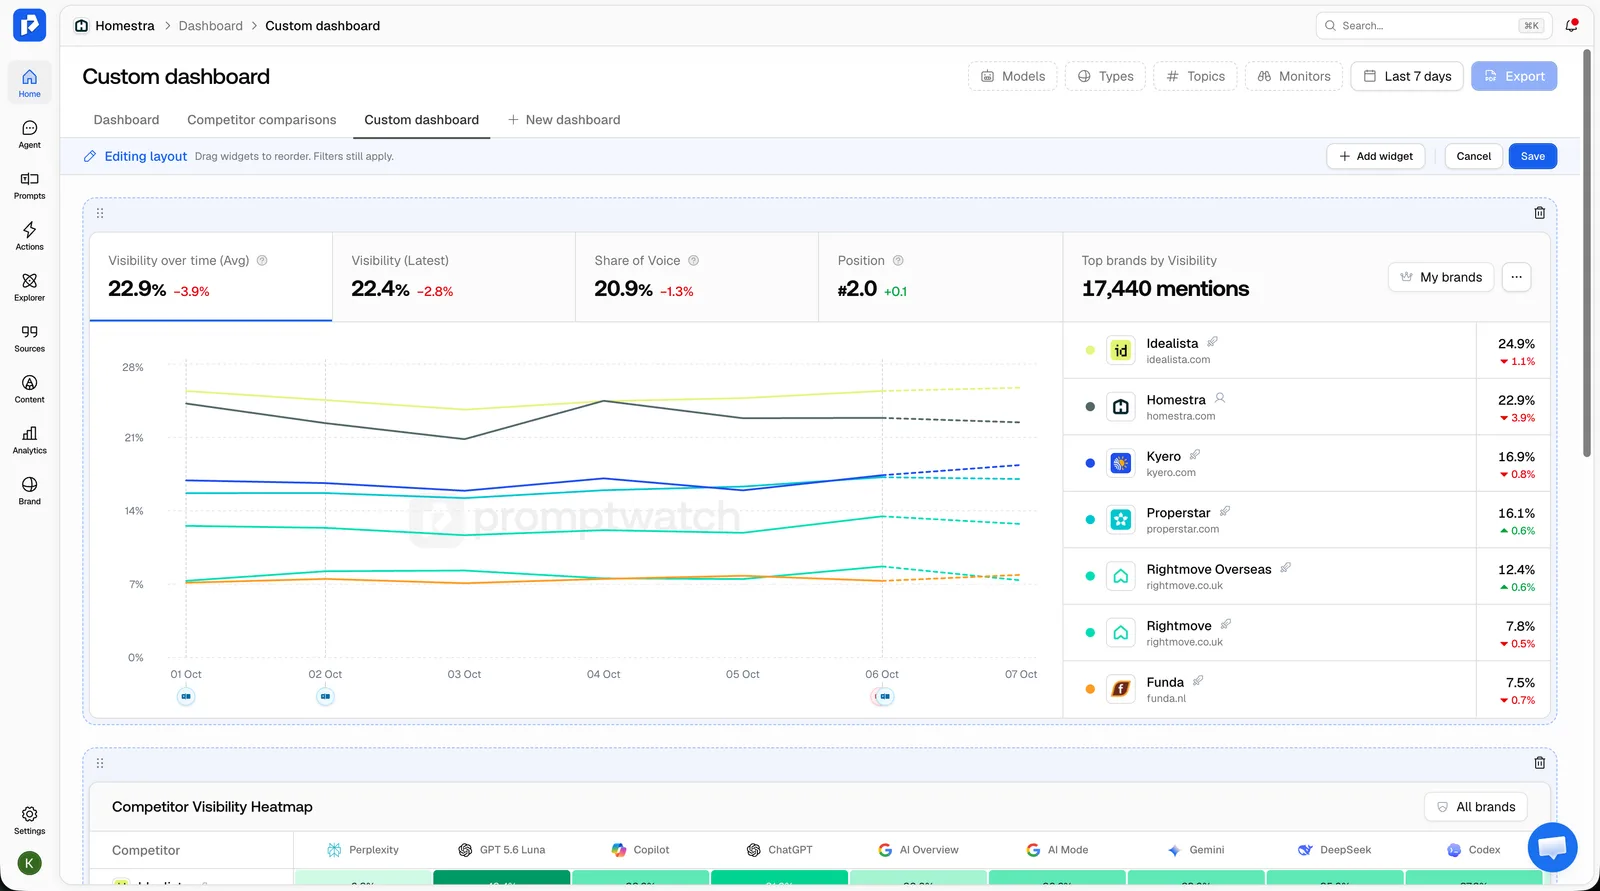 Promptwatch custom dashboards, from the Promptwatch changelog (September 28, 2026). Example project data.
Order matters as much as selection. On September 28 custom dashboards stopped being a copy of the Overview: you add the widgets you want and drag them into order. We order the review dashboard in the same sequence as the meeting agenda, so walking down the page is walking through the meeting. The brand visibility widget shows an average over the period and a latest value. In reviews we lead with the period figure and mention the latest one as direction of travel, because a single day can mislead in both directions.
What we leave off is the longer list. Top cited domains, Reddit posts, YouTube videos, visibility by country: every one of them is useful, and every one can start a twenty-minute tangent with a client who has forty-five minutes. If a program is specifically about citations or one market, the relevant widget earns a place. Otherwise it lives on the team's dashboard.
What goes on the team's working dashboard
The team's view is busier and changes often, which is fine because it's personal. Ours usually carries visibility by country, top cited domains and URLs, the top Reddit, YouTube, LinkedIn, and Instagram posts AI cites (the Instagram widget arrived November 4), and a heatmap set to something other than brands against models. The heatmap has been a general one since October 8, so topics against models is a common choice when we are hunting for the subject a single engine ignores. For clients who sell to distinct buyer types, the persona radar from Persona Insights is available as a widget too.
The other thing the team leans on is Agent Chat inside the dashboard. Since October 28 the panel opens on the main dashboard and every custom dashboard and reads every widget, so "why did our score drop?" gets answered for the period you picked. That is a daily-use feature. We don't run it live in front of a client. We use it the day before the review to find the explanation, check it against the responses, and then write the one sentence that goes in the notes.
Templates and chat-built drafts
New dashboards start empty, which is honest but slow. Since October 14 there are four templates (competitor comparison, topic gaps, AI model breakdown, and citations), and since November 2 the new dashboard dialog shows a preview of each template's layout before you pick one. For a review dashboard we start from competitor comparison and usually borrow the model heatmap from the AI model breakdown layout. Topic gaps and citations tend to become team dashboards.
Agent Chat and the MCP server can also build a dashboard from widgets, saved filters, and widget settings, or start one from a template. Dashboards made in chat are personal by default. That default suits our split nicely. A drafted dashboard starts life in someone's personal space, the account lead checks that the monitors, models, and date range match the scope we agreed with the client, and only then moves it to the team, which you do from the tab menu.
Getting the review copy to the client
There are three routes, and we use all of them for different people.
The first is the live link. The dashboard URL carries every filter, so a shared link opens exactly the view you saw. A client contact with access to their project can also land on it by default: set a team dashboard as the default and it opens whenever someone goes to the project. For a client who logs in once a month, landing on the review dashboard instead of the full Overview saves a confused phone call. Seats are now unlimited on every plan (November 4), so giving a client's marketing team access no longer means rationing logins.
The second is the scheduled PDF. Since October 2, custom dashboards can be exported and scheduled as PDF reports containing the widgets you put on the dashboard, in the same order, titled with the dashboard's name. Team dashboards can be scheduled to anyone with access to the project. Personal dashboards can be scheduled to their owner only, which is one more reason the review dashboard is a team one. The email's "View report in app" link opens the dashboard as saved, so a stakeholder who wants to dig in lands on the live page.
The third is the forwarded PDF with our note on top. Most clients get this one. A chart without interpretation invites the wrong conclusion, so the account lead adds a few lines on what moved and what we want the client to decide. We describe the meeting itself in the agenda we use for the monthly review.
On branding: white-label organizations can export and schedule PDF reports with their own branding. Promptwatch's own documentation places the white-label dashboard and client portal on Enterprise, and the self-serve agency plans don't include it. If a client needs reports under your agency's name, scope that conversation before you promise it.
Where Promptwatch fits
Promptwatch is the platform we run client programs on, and the split above depends on features it has: saved team and personal dashboards, widgets you choose and order, templates, chat-built drafts, a default team dashboard, and PDF schedules that follow the dashboard. The self-serve agency plans are Kick-off at $199 a month, Growth at $399, and Scale at $799. All three include unlimited projects and seats, Agent Chat, custom reports, and the Looker Studio connector, so the choice between them comes down to response volume and the extras on Scale, not reporting access. White-label sits on Enterprise.
If you want to see how a review dashboard and a working dashboard look on your own client set, book a demo with Promptwatch and bring the competitor list you would put in front of the client.