AEO reporting tools for client reports
How we structure a monthly AEO client report, read the metrics together to name the real problem, and which reporting tools build it: dashboards, PDFs, Looker Studio.
An AEO report has a harder job than an SEO report. Rankings are a familiar language: position 3 last month, position 2 this month. AI visibility has no equivalent that a client already understands. A report that lists a Visibility Score, a Share of Voice figure and a sentiment number in a row will be read as three unrelated percentages, and the client will remember whichever one went down.
So our monthly report is built around one idea. Each metric answers a different question, and read together they point at one problem to work on next month. Below is the structure we use, how we read the numbers, and the reporting tools that produce it. For the tools behind the data, see what we think the best AEO tools are.
The monthly report, page by page
We keep the report to five pages. Clients forward it, and a forwarded report gets skimmed.
Page 1: the headline. Visibility Score and Share of Voice for the client's main monitor, against the previous period and against the three competitors the client cares about. One sentence on what moved and one on why.
Page 2: the diagnosis. Which of four problem types this month's numbers point to, with the evidence. More on this below, since it's the page that makes the report useful.
Page 3: sources. The pages engines cited in the client's category, how many of them belong to the client, and which third-party pages did the work for competitors.
Page 4: traffic. AI-referred visits and conversions to the client's site, by engine and by landing page.
Page 5: work done and next. What we shipped, what's queued, and what we need from the client.
Reading the metrics together
The definitions come from Promptwatch's own metrics documentation, and they're specific enough to diagnose with.
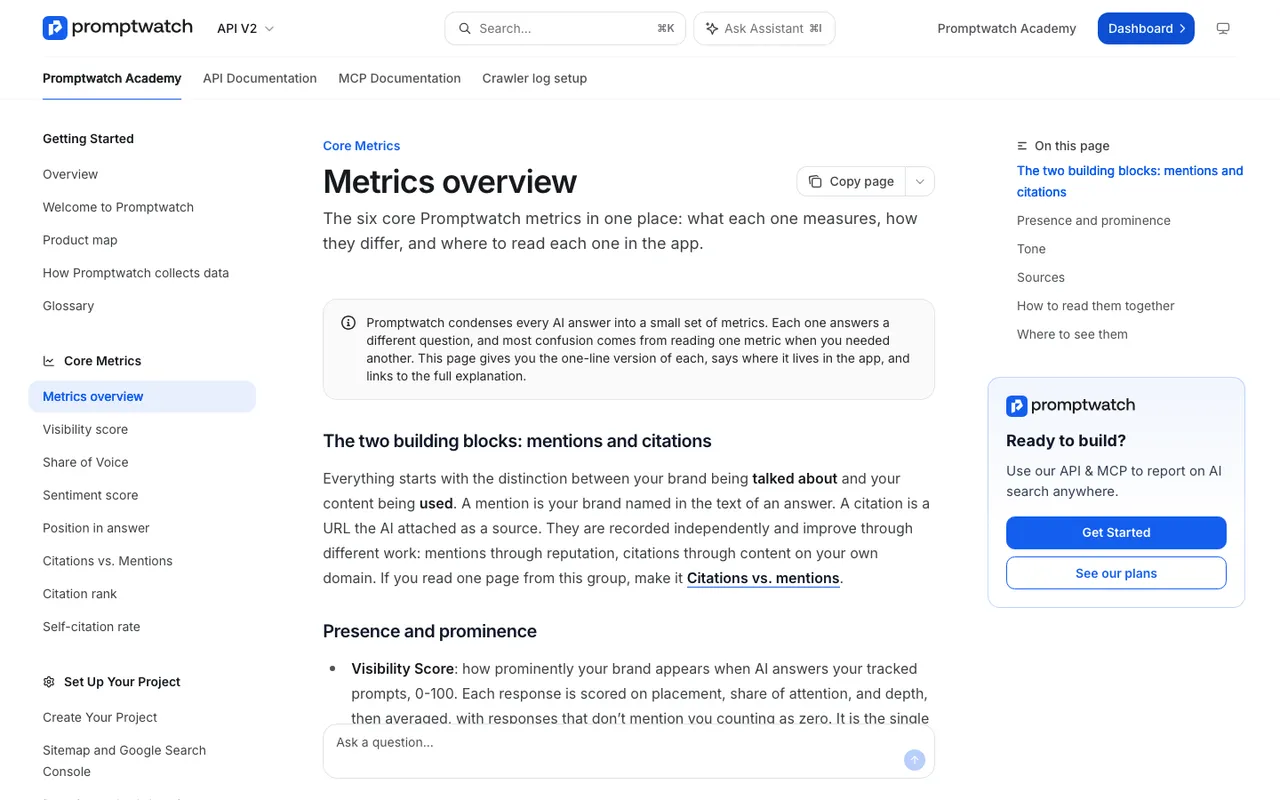 Captured November 14, 2026: the Metrics overview in Promptwatch Academy.
Visibility Score runs from 0 to 100. Promptwatch rates every response for placement, depth and how much of the answer's attention the brand gets, then averages the ratings, and a response without the brand counts as zero. Share of Voice is the brand's portion of every brand mention under the active filters, counting each brand once per response. Position is the brand's place in the running order of brands named in an answer, averaged only over answers that name it, so a lower number is better. Self-citation rate tells you how many citations go to the brand's own domain instead of somebody else's page.
Promptwatch reads these together, and so do we. This is the table on page 2 of every report:
| What the numbers show | Problem type | What we do next |
|---|---|---|
| Low Share of Voice | Coverage: the brand is absent from too many answers | New content for uncovered prompts and topics |
| Mentioned, but late Position | Prominence: named, but after competitors | Comparison pages, third-party coverage, sharper positioning |
| Mentions without self-citations | Content or crawlability: engines talk about the brand but use other pages | Check crawler access, then rewrite pages to be quotable |
| Weak sentiment | Reputation: the description is negative or wrong | Brand Narrative and source fixes |
Several rows can apply at once, but we name one as the dominant problem for the month. Naming it on page 2 means the client reads the rest of the report as evidence for that one problem instead of a list of numbers.
Why position gets its own line
Position deserves attention because answers are crowded. Of the ChatGPT responses that cited anything at all between September 28 and October 4, 2026, 47.6% cited 10 or more domains, according to Promptwatch's unique domains report. If the client is one of many names in a long answer, being mentioned is not the same as being chosen.
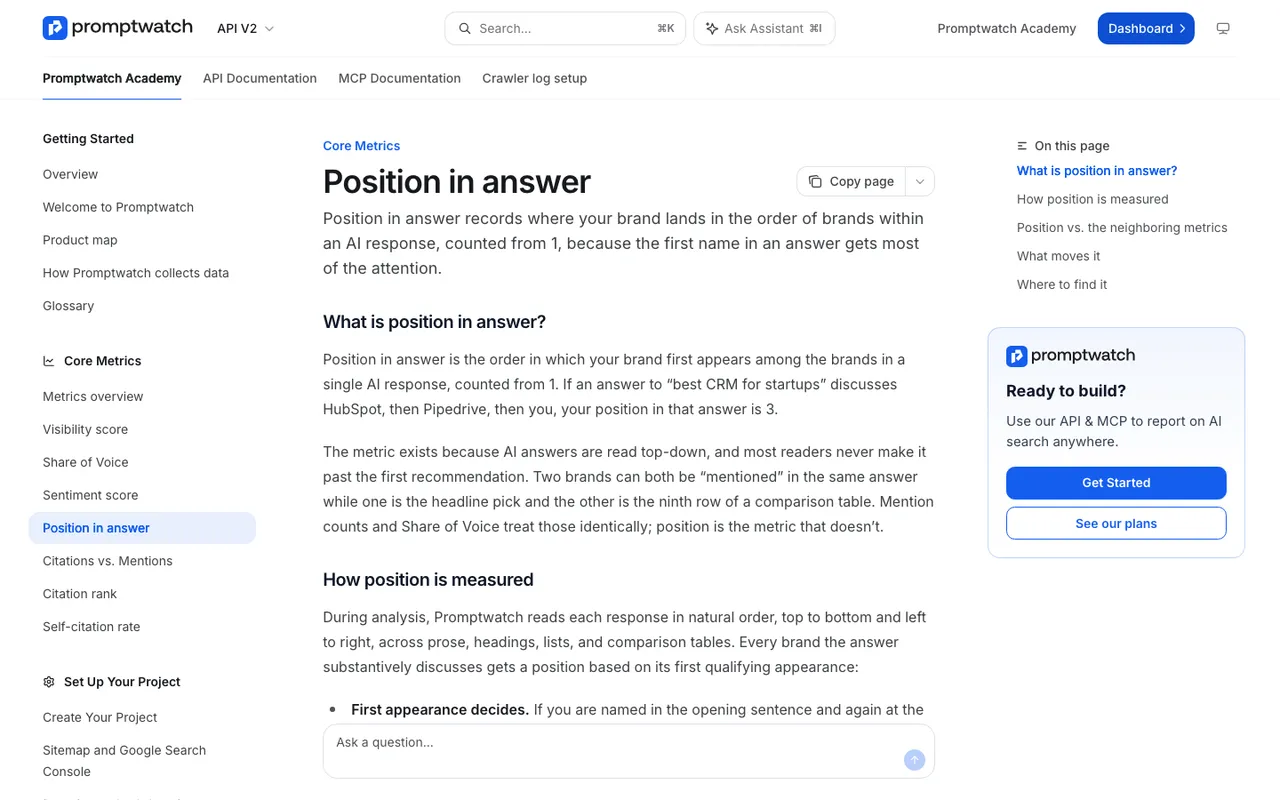 Captured November 14, 2026: Promptwatch Academy on Position in answer.
Citations: the page clients ask about most
Citations are the easiest metric to explain, because a citation is a link to a page anyone can open. We show two numbers. Citation rank tells you how high the client's domain sits in an answer's list of sources, with rank 1 as the primary source. Self-citation rate shows how much of the sourcing the client owns.
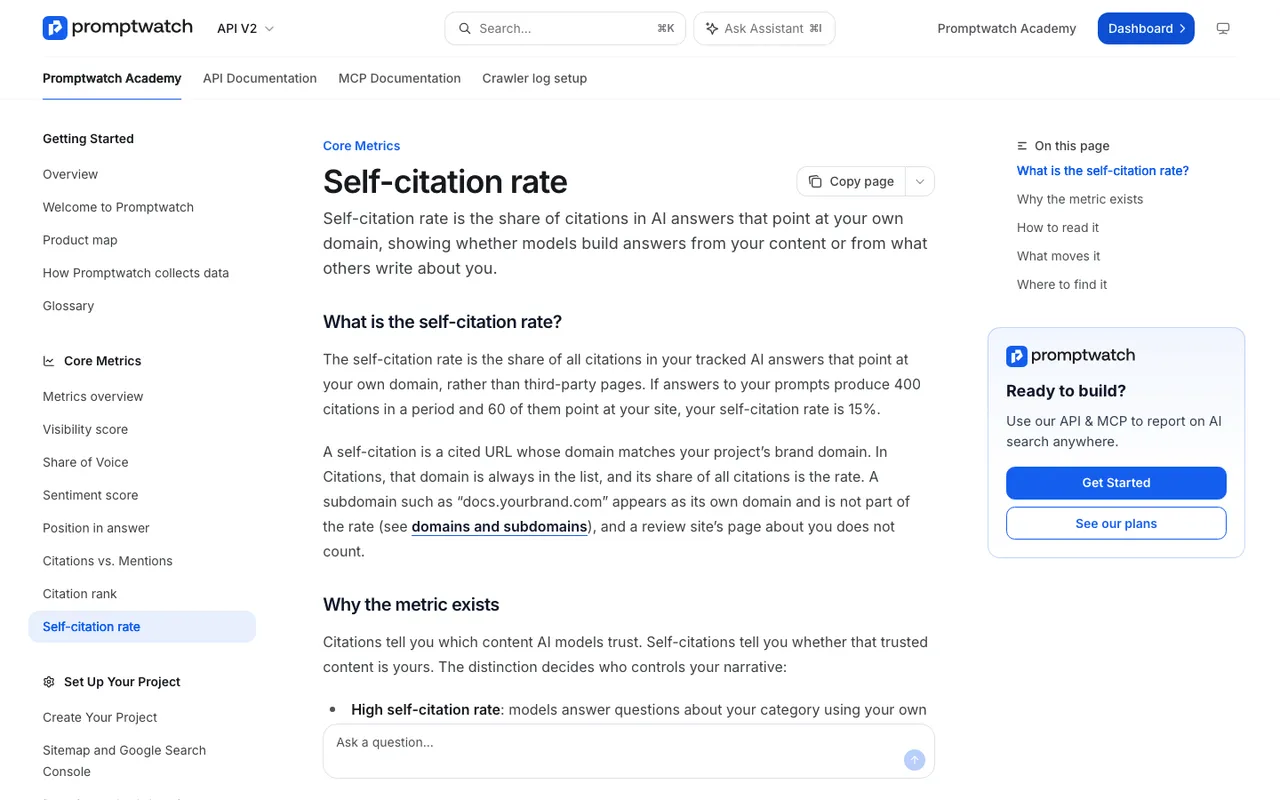 Captured November 14, 2026: Promptwatch Academy's article on self-citation rate.
A low self-citation rate isn't automatically bad. In some categories, review sites and forums carry most answers, and the right move is to be well represented there. The report says which case applies.
The reporting tools that build it
All of this comes out of Promptwatch, the platform we run client programs on. These are the parts we use, with their plan limits.
Custom dashboards. A dashboard can be shared with the team or kept personal, it keeps its filters, and it can start from one of four templates (citations, AI model breakdown, topic gaps, competitor comparison). We build one client-facing dashboard per account and keep our working views separate.
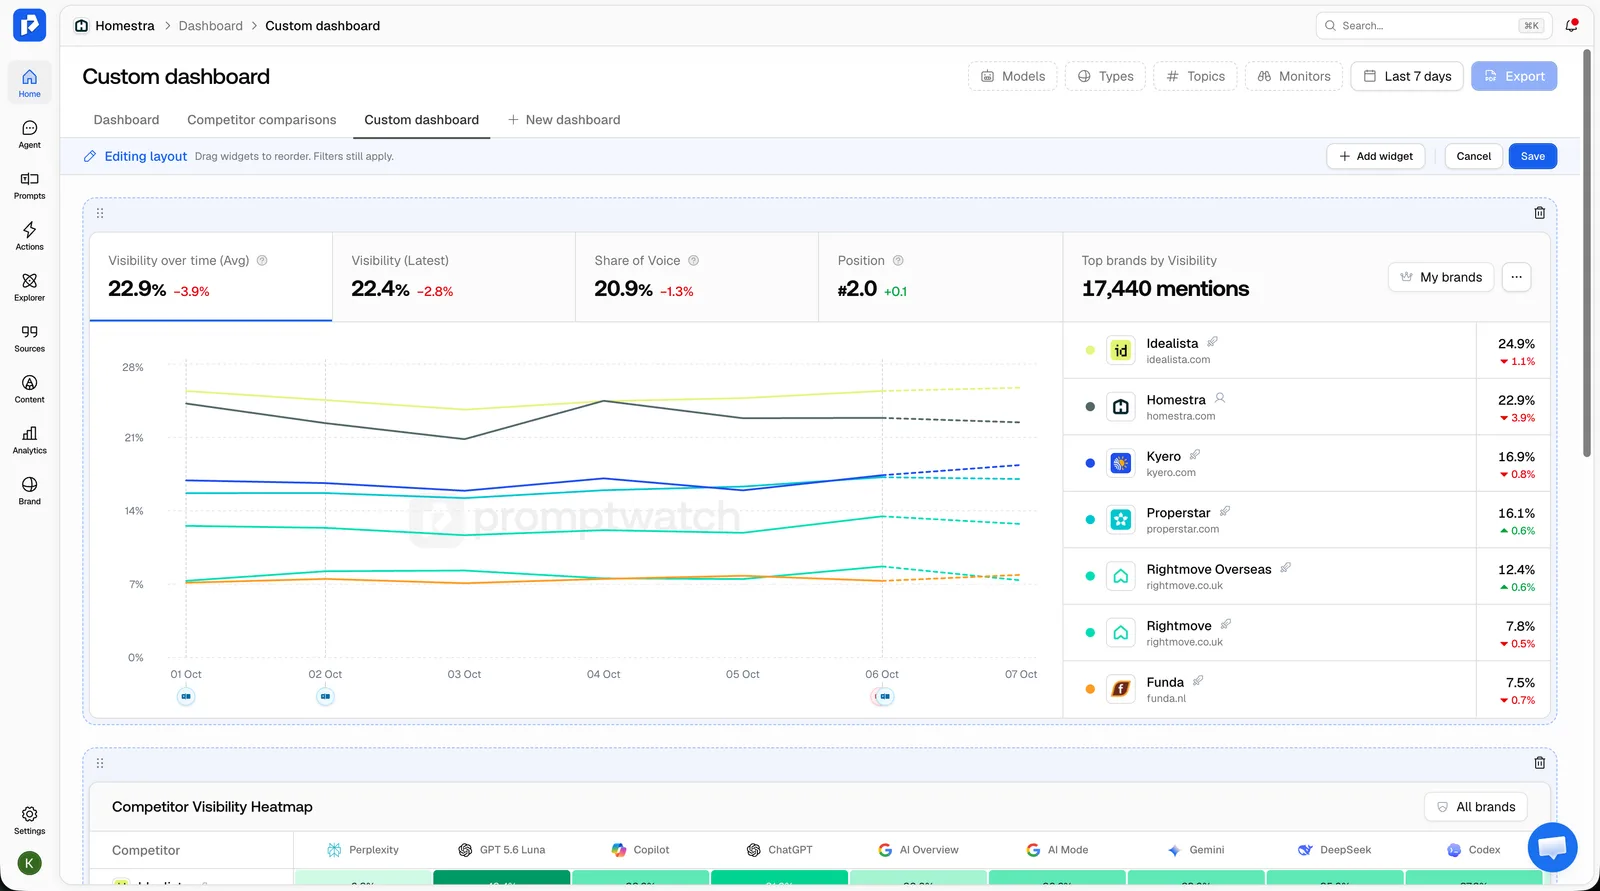 Captured November 6, 2026: a custom dashboard in edit mode, from Promptwatch's changelog, using an example project.
Sentiment and Citations tabs. Since November 13, 2026, each project has two fixed tabs beside its main dashboard. The Sentiment tab carries a sentiment trend and a brand-by-topic sentiment heatmap. The Citations tab lists the most cited domains and URLs, plus the YouTube videos and the Reddit and LinkedIn posts that engines cite. Together they cover page 3 and part of page 2 with no setup.
Scheduled PDF reports. Every brand plan includes 10 scheduled PDF reports. A schedule can follow any dashboard or tab and takes its name. If you schedule a custom dashboard, later widget edits flow into the PDF. The PDF can be filtered by monitor, model, prompt type or topic.
Looker Studio. Promptwatch's Looker Studio connector comes with templates. Professional is the first brand plan to include it, and every agency plan has it. For clients who already report SEO and paid search in Looker Studio, AEO numbers go into the same report, which is the setup Promptwatch's Monks case study describes: dashboards combining LLM visibility with organic and paid search.
Exports and API. Exports go to Excel or CSV with a column picker, and cover responses (each brand listed with its position), prompts, crawler data, citations and more. Every paid plan also gets the REST API and the MCP server, for agencies that build their own pipelines.
Scheduled Chats. Every brand plan has 10. We use one for a weekly internal briefing in Slack, not for the client report.
Branding. White-label dashboards, client portals and branded PDFs are on Enterprise and Partner plans only. On self-serve agency plans, reports carry Promptwatch branding, and we tell clients that up front.
One fix from November 13, 2026 matters for anyone comparing periods. Comparisons now set the selected range against an earlier period that is just as long. Before that, "Last 14 days" was compared with 15 days. If you compare a November report with older exports, note the change.
Other tools' reporting, from our catalog
BrightLocal's Local AI Visibility has no export or white-label reporting yet, per its help center, so agencies show results inside BrightLocal. SE Ranking lists white-label agency reporting next to its AI Search add-on. LLM Pulse puts its Looker Studio connector and API on the €299 Scale plan. These are fine for a client who only needs a visibility chart. A report that also explains crawler access and conversions needs data those tools don't publish.
What we leave out
We don't report a single day's answers as a trend. We don't put a number in the headline without the comparison period. We don't use screenshots of individual answers as proof of anything beyond that answer. And we never forecast a score.
Pitch reports for agencies
On agency plans, Promptwatch's AI Visibility Reports turn any website into a PDF of what ChatGPT, Gemini and Google AI Mode say about it, in roughly five minutes. The monthly allowance is 20 reports on Kick-off, 40 on Growth and 60 on Scale. We use them before a client signs, not as the monthly report.
To see this report structure built on your own data, book a Promptwatch demo. Bring last month's report and ask how each of its five pages would come out of a scheduled PDF or the Looker Studio connector.